Double Machine Learning (DML) Framework
Introduction
Double Machine Learning (DML) is a framework designed to provide more accurate inference about causal relationships in observational data where traditional methods might be biased due to the presence of many confounding factors. The framework combines machine learning techniques with econometric methods to control for a large number of potential confounders.
Modeling Assumption
DML framework estimates the causal effect of some treatment variables (T) on some outcomes of interest (Y) based on the following data generating process (DGP):

where,
Y denotes outcome variables (e.g., visit, conversion,
sales…)
T denotes advertising variables (e.g., ad airing, ad
spending, ad impression)
X denotes moderators (e.g., daypart, day
of week, ad spot length…). The impact of advertising varies as a
function of X
W denotes confounding variables (e.g., time related
factors, other advertising insertions). These confounding variables pose
a major threat to obtaining the causal effect. When these confounding
variables are not properly controlled, the estimate of advertising
effect will be biased and thus potentially lead to suboptimal
advertising decisions. Another way to interpret W is that our model uses
W to form a baseline outcome without treatment, so that we will be able
to compare the outcome with or without treatment to obtain an accurate
causal estimate.
Solving a causal inference problem
requires indepth understanding of the underlying DGP and relies on
strong assumptions on the functional form of the DGP. DML framework
provides a unique data-driven method to relief us from imposing strong
assumptions of functional forms of the DGP. DML framework transforms the
causal model estimation problem into two different prediction problems,
and one can apply the state-of-the-art machine learning algorithms to
approximate the complex relationship between the underlying factors and
estimate the causal effect of advertising. This includes a two step
estimation process:
Step 1: Machine Learning
-
Predicting the outcome (Y) from the controls (W,X) to obtain residual
(ɛ_y)
- Predicting the treatment (T) from the controls (W,X) to
obtain residual (ɛ_t)
Step 2: Causal Inference
-
Regressing ɛ_y on ɛ_t to obtain the causal estimate
Application to the Spike Analysis
We apply our framework done at the station level. Therefore, for each
station, we have a specific set of predictive and inference models to
quantify the causal effect of inserting an ad to the station on the key
outcome metrics. In our empirical demonstration, the specification is as
follows:
Y: Number of sessions in the next 10 minutes
T: Binary treatment variable for a specific station (1 if an ad
is aired; 0 otherwise)
X: daypart, length
W: Ad airings
from other stations, Seasonality (hour, weekday, month, year), Previous
number of sessions
Model:
Step1: We utilize random
forest the predict Y and T using W and X and conduct hyper-parameter
tuning and cross-fitting to avoid overfitting.
Step2: We utilize
ordinary least square (OLS) to obtain the linear approximation of the
heterogeneous treatment effect as a function of X.
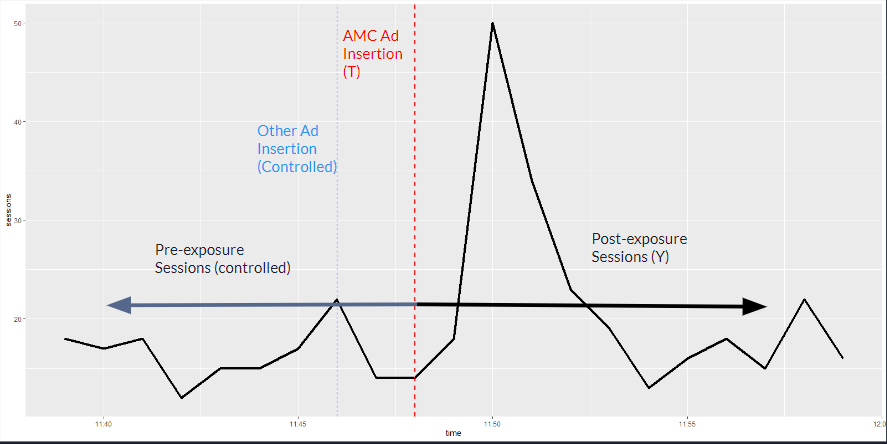
Figure 1 below demonstrates the how our control variables capture the potential baseline without ad insertion:
Results
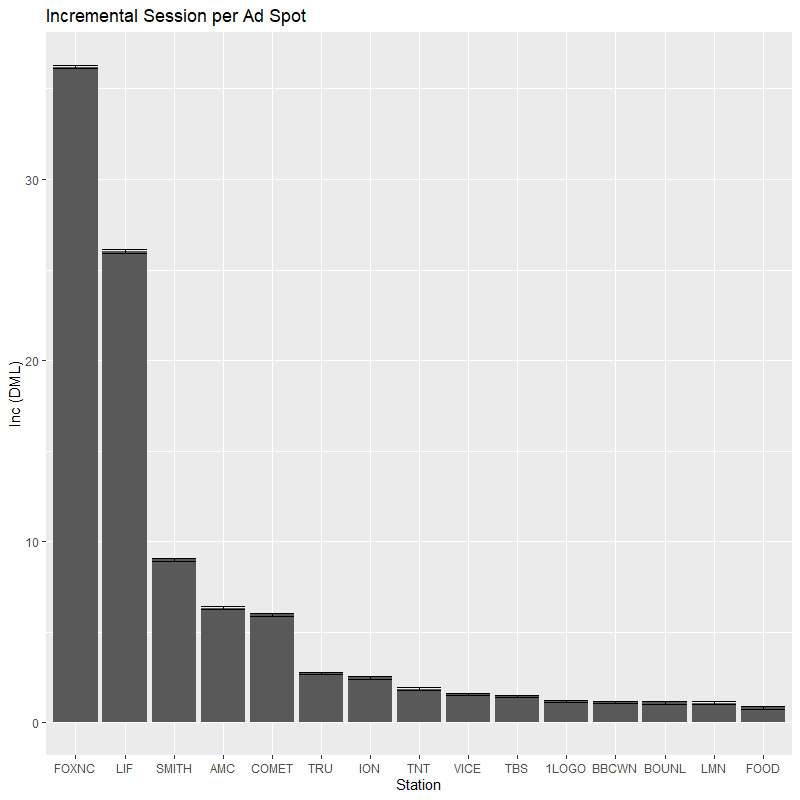
DML estimate
Our DML framework is able to provide an accurate causal estimate of the effect of an ad insertion on web visits. Figure 2 below demonstrates the estimated incremental visits by an ad insertion in a station. In general, causal effects of ad insertion across different TV stations are positive and statistically significant.
Compare with the spike analysis
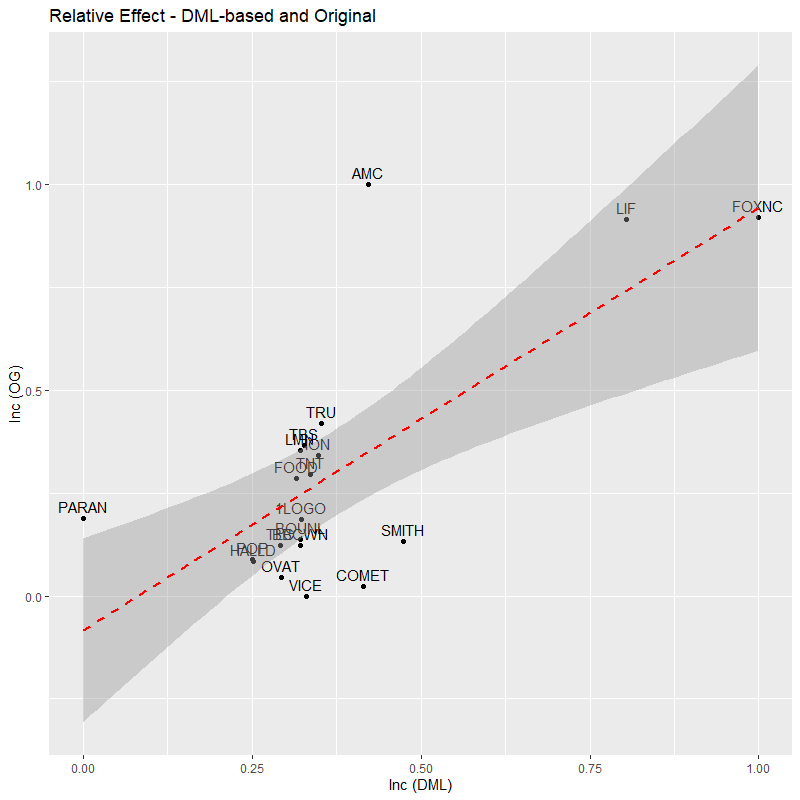
We further compare the results obtained by the DML framework with
those from the original spike analysis (the current NRT model). Figure 3
provides this comparison. On the X-axis is the normalized incremental
estimate by the DML framework, and on the Y-axis is the normalized
incremental from the current NRT model. Generally, the results
demonstrate a high correlation (0.7***), suggesting that our original
framework can already provide a reasonably good estimate of the causal
effect. However, there are still some discrepancies. For example, all
the stations above the red line are predicted to be more effective based
on the original framework than the DML framework suggests, and
conversely, stations below the red line are underestimated by the
original framework and overestimated by the DML framework. These
differences present potentially fruitful opportunities to further
optimize our current ad allocation strategy. Here, the DML framework
provides a ‘second opinion’ for re-evaluation of the current ad buying
decisions.
These observed discrepancies, while highlighting the robustness of our original analysis, underscore the importance of integrating diverse analytical approaches like the DML framework for enhanced precision. Leveraging the insights from DML, we can fine-tune ad buying to target stations more accurately, thus maximizing the return on investment. Furthermore, the DML framework’s nuanced analysis can inform our broader strategic decisions, helping us to identify patterns and trends that may not be immediately apparent through traditional methods. By embracing this advanced analytical framework, we are poised to not only improve the efficacy of individual ad placements but also to refine our overall marketing strategy in a data-driven manner.